The three major types of weather phenomena we will discuss will be anticyclones (high pressure systems), cyclones (low pressure systems...aka hurricanes), and temperate frontal depressions.
ANTICYCLONES and CYCLONES
Anticyclones and cyclones are best shown in the following video. You may need to watch it a few times to get it,but he does a really good job of explaining them.
Before we get into what temperate frontal depressions are, we will need to know what those symbols we always see on weather maps mean. You would have seen some in the video above. Look at and study the graphic below.
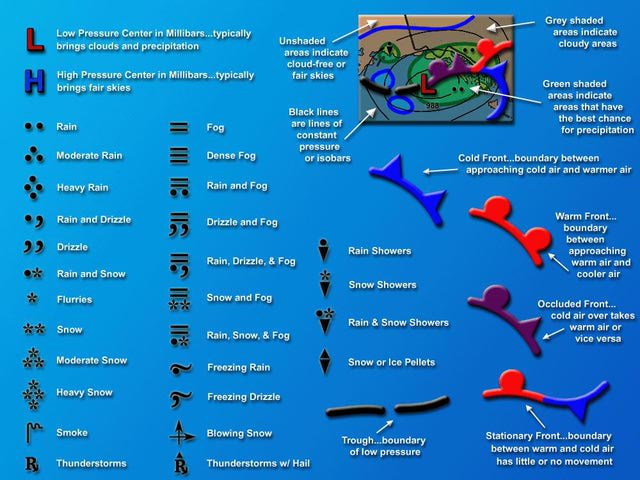
When
two air masses meet, they do not mix readily due to differences in temperature
and density. A
front is an imaginary line separating two contrasting air masses. Fronts
are areas where rainfall takes place.
A
warm front is found when warm air is advancing and rises over cold air, which
is denser and heavier. As
the warm air rises it is cooled and condensation takes place. Continued
condensation leads to the growth of water droplets and when heavy enough these
fall as rain.
A
cold front occurs when heavier cold air is advancing and pushes beneath a body
of lighter warm air.
The
name of the front is specified by the temperature of the moving air.
Depressions
are areas of low pressure, bringing unsettled weather of cloud, rain and wind.
Example: For
the UK, they form over the Atlantic Ocean where warm tropical air meets cold
polar air. Fronts
occur where these two different air masses meet and are unable to mix. The
depression becomes more extensive as it moves eastwards towards the UK. By
the time a depression reaches the UK it has a warm and cold front. The
cold front travels faster than the warm front squeezing the warm sector air
upwards between the fronts. Eventually
the cold front will catch up with the warm front and, as the warm sector
disappears from the ground, form an occluded front. The
depression dies out when the warm air has completely risen and cooled. It now
has underlying cold air and the temperature differences have equalled
out.
Forecasting Depressions
Differences
in pressure are shown on a weather map by isobars, which are lines joining
places of equal pressure. Pressure
is measured in millibars (mb)
and it is usual for isobars to be drawn at 4mb intervals. The
closer together the isobars, the greater the difference in pressure (the
pressure gradient) and the stronger the wind. Winds
follow, or bend slightly inwards from the isobars. You can see an example of isobars on a couple of weather maps below. We will discuss them in class. They work very similar to elevation on a topographic map.

This next one shows many features that were given in the legend at the beginning of the section.

Looking at the isobars can tell forecasters how strong winds may be, where fronts may occur, and then combined, what weather conditions are most probable to come.
In addition to the weather charts, forecasters will use satellite data and infra-red photography to look at the weather and make their predictions. View the fun cartoon below to get some more info on satellite use in forecasting.
In addition to the weather charts, forecasters will use satellite data and infra-red photography to look at the weather and make their predictions. View the fun cartoon below to get some more info on satellite use in forecasting.
Thanks for sharing such a great article, This is my first time on your blog and i am your fan now. keep it up..
ReplyDeleteWe are Air Pollution Control System India
Final Assembly Systems India
Final Assembly Systems India
ReplyDelete