Air pollution is a major cause of illness around the world. Please click on this link and read about the causes, effects, and potential solutions to the problem. I will also go over some details in class on specific pollutants. You can find those notes in the link for "Ch. 15" below.
While it may seem trivial in comparison to urban air pollution, noise pollution is a major problem for many areas. Watch the following video and take notes to learn what you need to know.
Climate Change. We've all heard it, know there's something controversial about it, but may not know the science behind it. We were introduced to some effects of climate change in the hydrosphere unit (sea level rise, etc.), but how does climate change work? More specifically, what have humans done to contribute to it? And, what can we do about it?
Greenhouse Gases
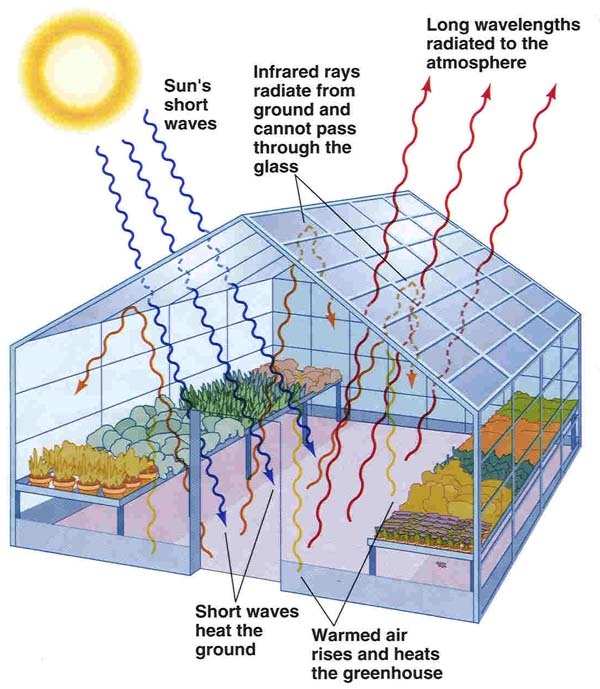
To understand how climate change works, we must first study the greenhouse effect, caused by greenhouse gases. Think about a greenhouse...those glass-walled structures used to grow plants. Radiated heat from the sun is moving so fast that it passes right though the walls. After it rebounds, the infrared waves do not have enough energy to pass back through, and thus get trapped. This causes the structure to get warmer, resulting in accelerated growth of plants. A diagram of this is below.
You can think of greenhouse gases in our atmosphere as acting like the panes of glass in a greenhouse. They let the radiation from the sun in, but trap the infrared waves in the form of heat on the Earth. Let's get this straight...WE NEED GREENHOUSE GASES! Without them, the Earth would be too cold for life to exist. BUT, we are pumping so much into the atmosphere that it's like making the panes of gas thicker...they trap more and more heat, changing the climate of the Earth. Gas concentrations have changed over the history of the Earth, but usually slowly over thousands over years. We are seeing the highest amount of CO2 (a major greenhouse gas) in the past 400,000 years, as evidenced by the graph below (courtesy of NASA).
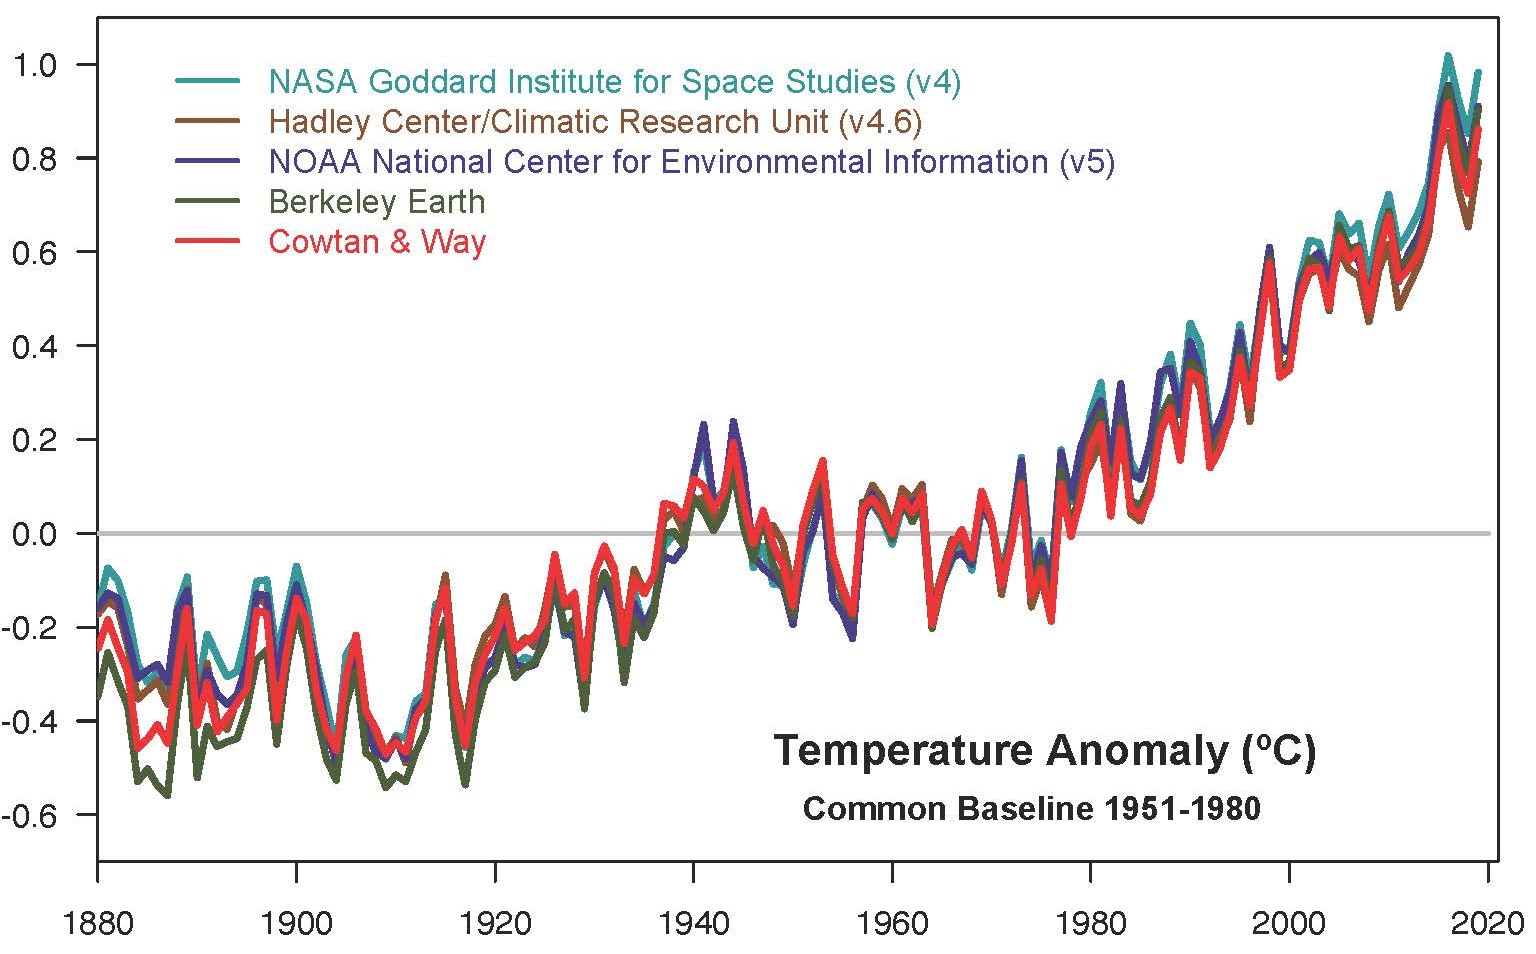
We can get that CO2 data by looking at ice cores in arctic areas. It's harder to measure historical temperature, but we do have reliable global data since 1880, as evidenced by the graph below.
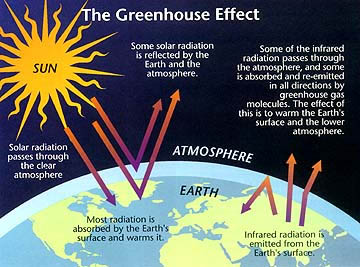
Here's a diagram of the process:
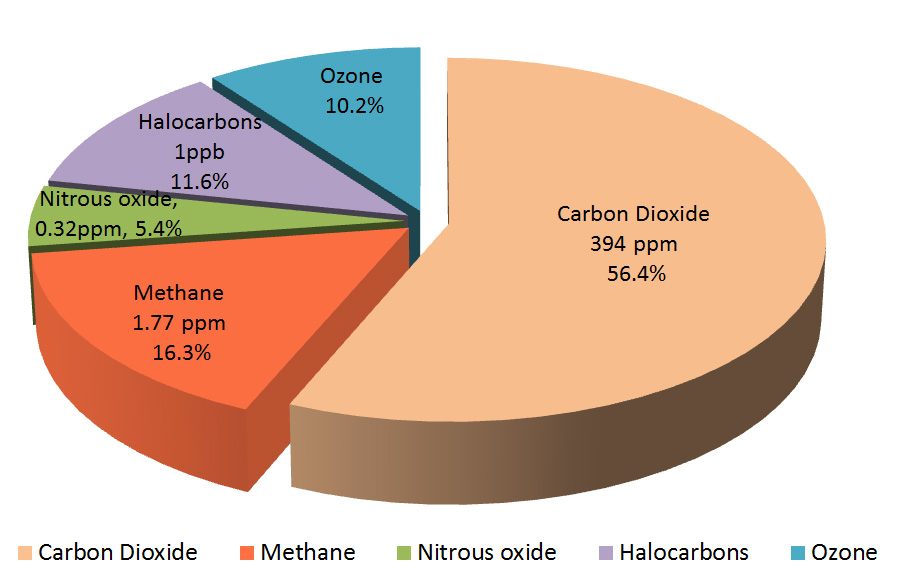
We tend to focus on carbon dioxide, because we make A LOT of it, but there are other greenhouse gases as well. The relative abundances of greenhouse gases are shown in the infographic below.
We need to work on reducing all of the greenhouse gases, but as you can plainly see, carbon dioxide will be the easiest for us to reduce because we make so much of it via combustion of fossil fuels for electricity(coal), transportation (oil), and industry (both). Methane is a big problem as well, because it actually has a stronger greenhouse impact over carbon dioxide. It's a big player from cattle/agriculture.
Predictions for Climate Change
The evidence is fairly overwhelming that the Earth as a whole is warming, and it's unnaturally accelerating due to human contributions. It makes sense. Does that mean we'll not have any cold times? NO! It will just change the average temperature overall in an increasing way. We will still have snow storms, maybe even more intense because of the climactic changes. But, what are the predictions for the future and how do we make those predictions? What do leading scientists think will happen? Watch this video from the SciShow for some insight.
So, to summarize the impacts, a warming climate may result in:
- Melting
of polar ice caps
- Flooding
of coastal areas
- Massive
migrations of people inland
- Alteration
of rainfall patterns
- Deserts
becoming farmland and farmland becoming deserts
- Significant
losses in crop yields
- Stronger and more frequent storms (due to more water evaporation during formation)
How soon or if these events will come to pass is up for debate, but we are seeing some impacts now. It is imperative that we address climate change, as even the threat of these events warrants action.
Stratospheric Ozone (Good Ozone)
Ozone is a form of oxygen that contains 3 molecules as opposed to the oxygen we breathe that has 2. Thus, the chemical formula is O3. In the stratosphere, Ozone protects us from harmful UV radiation. You need to read about how here and here (take notes).
Now that you've read how vital stratospheric ozone is to all life on Earth, we need to discuss how we are affecting it. Humans have been creating chloroflurocarbons (CFCs) that have made a giant hole in that good ozone layer. You need to read about how here. Again, take notes - don't worry about names of specific CFC compounds, just use the page to figure out how they deplete the Ozone layer.
Tropospheric Ozone (Bad Ozone)
While the ozone is extremely necessary in the stratosphere, it is very harmful to humans in the zone we live in, the troposphere. Often times this is called ground level ozone. Watch the following cartoon to learn about how this ozone is formed and is harmful.
Acid Rain
You should've learned about acid rain in elementary school a bit, but we need some deeper info. Read through this HowStuffWorks.com site to learn what you need to know about it. Please read down to the bottom of all 5 pages. There's also a great podcast on 'What Ever Happened to Acid Rain' on the bottom if you have time.
Recall back to 4.2.1 when we discussed wind. It is air movement from areas of high pressure (cold) to areal of low pressure (warm). This happens because the warm air rises, creating the low pressure below. The cool air rushes in, causing wind. This is the basis for most weather events and forecasting which we will discussed here.
The three major types of weather phenomena we will discuss will be anticyclones (high pressure systems), cyclones (low pressure systems...akahurricanes), and temperate frontal depressions. ANTICYCLONES and CYCLONES
Anticyclones and cyclones are best shown in the following video. You may need to watch it a few times to get it,but he does a really good job of explaining them.
TEMPERATE FRONTAL DEPRESSIONS
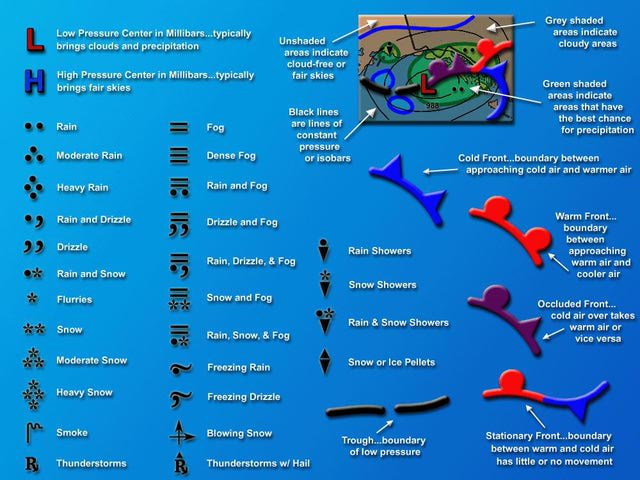
Before we get into what temperate frontal depressions are, we will need to know what those symbols we always see on weather maps mean. You would have seen some in the video above. Look at and study the graphic below.
When
two air masses meet, they do not mix readily due to differences in temperature
and density. A
front is an imaginary line separating two contrasting air masses. Fronts
are areas where rainfall takes place.
A
warm front is found when warm air is advancing and rises over cold air, which
is denser and heavier. As
the warm air rises it is cooled and condensation takes place. Continued
condensation leads to the growth of water droplets and when heavy enough these
fall as rain.
A
cold front occurs when heavier cold air is advancing and pushes beneath a body
of lighter warm air.
The
name of the front is specified by the temperature of the moving air.
Depressions
are areas of low pressure, bringing unsettled weather of cloud, rain and wind.
Example: For
the UK, they form over the Atlantic Ocean where warm tropical air meets cold
polar air. Fronts
occur where these two different air masses meet and are unable to mix. The
depression becomes more extensive as it moves eastwards towards the UK. By
the time a depression reaches the UK it has a warm and cold front. The
cold front travels faster than the warm front squeezing the warm sector air
upwards between the fronts. Eventually
the cold front will catch up with the warm front and, as the warm sector
disappears from the ground, form an occluded front. The
depression dies out when the warm air has completely risen and cooled. It now
has underlying cold air and the temperature differences have equalled
out.
Forecasting Depressions
Differences
in pressure are shown on a weather map by isobars, which are lines joining
places of equal pressure. Pressure
is measured in millibars (mb)
and it is usual for isobars to be drawn at 4mb intervals. The
closer together the isobars, the greater the difference in pressure (the
pressure gradient) and the stronger the wind. Winds
follow, or bend slightly inwards from the isobars. You can see an example of isobars on a couple of weather maps below. We will discuss them in class. They work very similar to elevation on a topographic map.
This next one shows many features that were given in the legend at the beginning of the section.
Looking at the isobars can tell forecasters how strong winds may be, where fronts may occur, and then combined, what weather conditions are most probable to come. In addition to the weather charts, forecasters will use satellite data and infra-red photography to look at the weather and make their predictions. View the fun cartoon below to get some more info on satellite use in forecasting.
Biomes are the major ecosystem areas around the world. Recall from section 4.2.1 - Climate is the average weather pattern of a certain area, and it is what determines the BIOME an area is divided into. Mainly, it's based on annual rainfall and temperature variations. These conditions determine which plants can grow, and thus which animals can occupy the area. You probably already know some biomes just by thinking about them - hot/wet = the rainforest, hot/dry = desert. There are more that we need to discuss because knowing the different biomes and their characteristics is vital to their protection and management, and all life on Earth. The major ones you need to know are discussed below: Equatorial Also
known as tropical rainforests, these are usually
located along the equator as shown in the graphic below:
The
latitude usually comes under the Doldrums Low Pressure belt all the year and
therefore there are almost
no distinct seasons. The
midday sun is always near the vertical and it is overhead twice a year, at the
equinoxes. Average
daily temperatures are typically at around 26.9°C (80.3°F) throughout the year.
Extensive cloud cover and heavy rainfall prevent diurnal temperatures from
rising much over 33°C (91.4°F.) Rainfall
is heavy and is usually convectional.
Here is a typical climatogram for an equatorial biome:
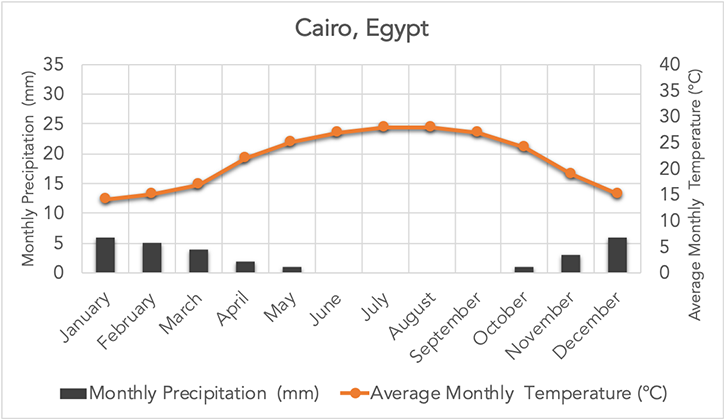
Tropical Desert
Tropical deserts are usually found in the the sub-tropics, as shown on the map below.
They are hot, and they typically have exceptionally hot periods of the year. In
many locations featuring a hot desert climate, maximum temperatures of 40°C to
45°C (113 F) are not uncommon in summer. During
colder periods of the year, night-time temperatures can drop to freezing or
below due to the exceptional radiation loss under the clear skies; however,
very rarely do temperatures drop far below freezing. They are typically dry year-round.
Here is a typical climatogram for a tropical desert biome:
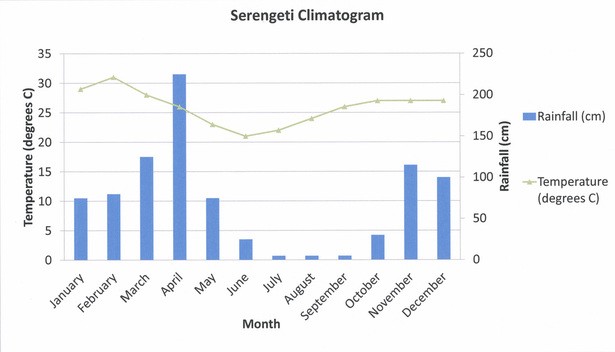
Savanna
Savanna biomes are usually found in the outer regions of the tropical zones, as shown on the map below.
Tropical
savanna climates have monthly mean temperature above 18°C (64 F) in every month of the
year and typically a pronounced dry season, with the driest month having
precipitation less than 60 mm. In
essence, a tropical savanna climate tends to either see less rainfall than a
tropical monsoon climate or have more pronounced dry seasons.
Here is a typical climatogram for a savanna biome:
Monsoon
Monsoon biomes are shown on the map below.
Tropical
monsoon climates have monthly mean temperatures above 18°C (64 F) in every month of
the year and feature wet and dry seasons,
as Tropical savanna
climates do. Also like tropical savanna climates, a tropical monsoon climate's driest month
sees less than 60 mm of precipitation but will always have some level of precipitation even in that month.A tropical monsoon climate tends to see less variance in temperatures during
the course of the year than a tropical savanna climate. This
climate has a driest month which nearly always occurs at or soon after the
"winter" solstice for that side of the equator. There is often yearly major flooding events in monsoon biomes, most notably in India, due to the extreme wet season caused by a change in wind pattern. For more detail on this, read about monsoons here.
Here is a typical climatogram for a monsoon biome:
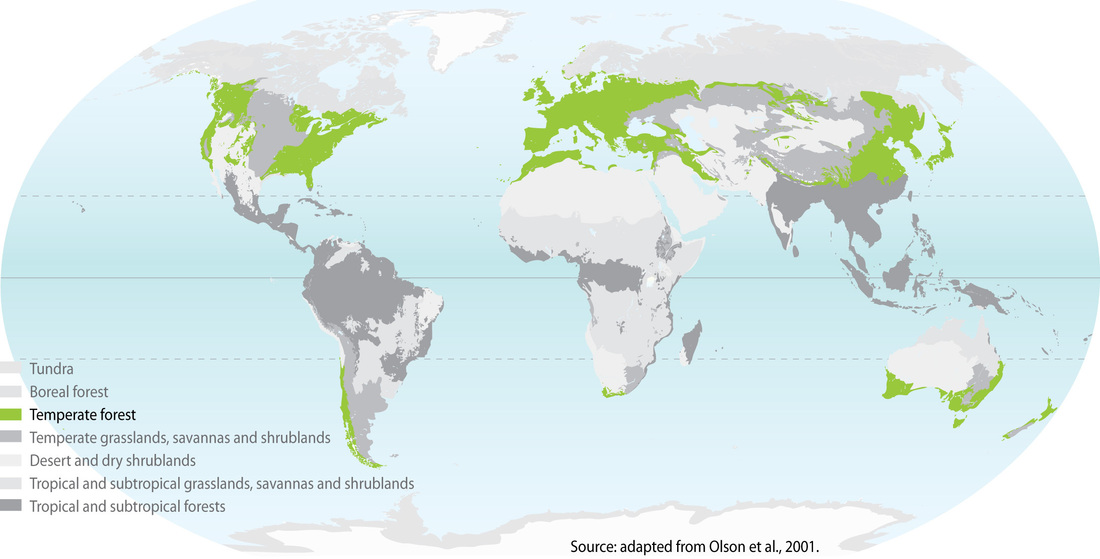
Warm Temperate
Warm temperate biomes lie between the tropics and polar regions, as shown on the map below (green areas).
The changes in warm temperate biomes between summer and winter are generally relatively moderate, rather than extreme hot or cold. There are usually 4 seasons and is home to most of world’s human population. In certain areas, such as Asia and central North America, the variations between summer and winter can be extreme because these areas are far away from the sea, causing them to have a continental climate. In regions traditionally considered tropical, localities at high altitudes (e.g. parts of the Andes) may have a temperate climate. It's not overly rainy or dry, thus the temperate description.
Here is a typical climatogram for a warm temperate biome:
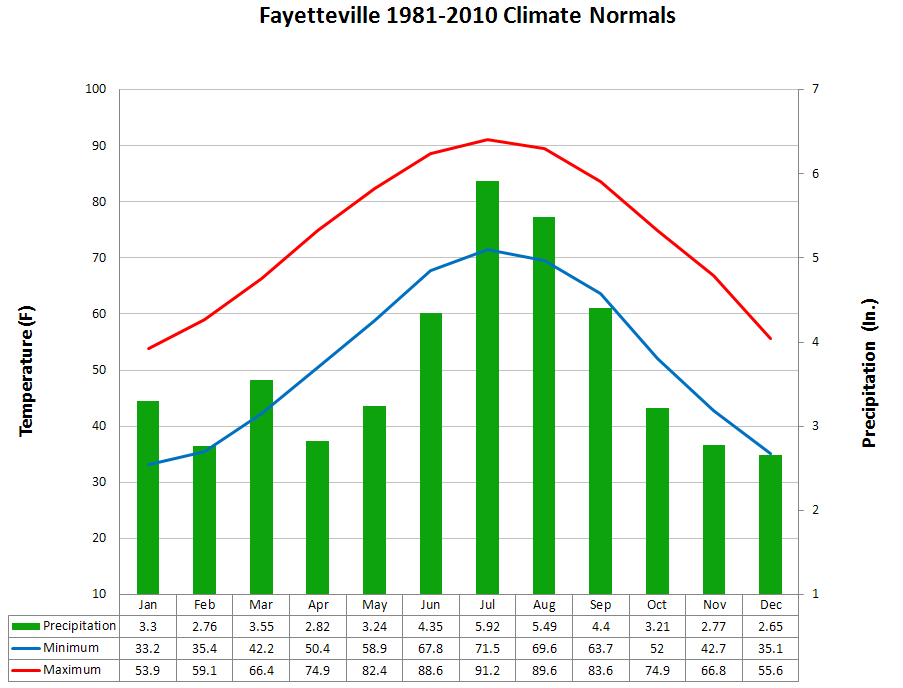
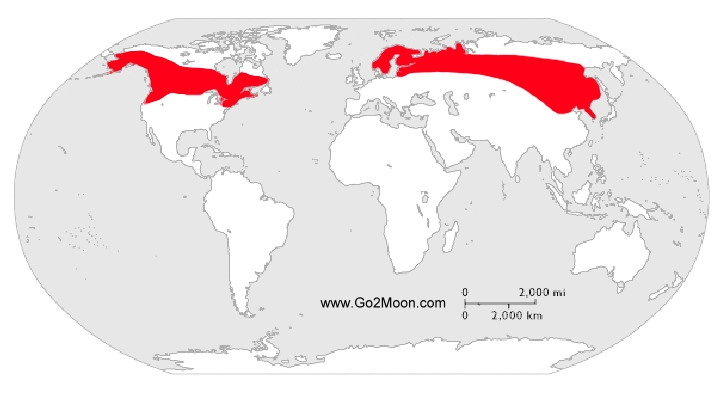
Sub-Arctic
The sub-arctic biomes are between 50-70 degrees latitude North on large landmasses, as shown in the map below.
The Sub-Arctic Biome is characterized
by long, usually very cold winters, and short, cool to mild summers. Most
subarctic climates have very little precipitation, typically no more than 15
inches (380 mm) over an entire year. Vegetation in
regions with subarctic climates is generally of low diversity, as only hardy
species can survive the long winters and make use of the short summers.
Here is a typical climatogram for a Sub-Arctic Biome:
We will get into more detail of the major Biomes, and even add some more, in the Biosphere unit.
Weather and wind patterns are extremely important in terms of life on Earth...determining when major natural events will occur, major climatic regions, and whether or not it's a good beach day! Many people confuse weather with climate, so what is the difference?
Weather
– What’s happening currently…a moment in time. Weather is if it's raining, snowing, hot, or cold.
Climate
– The average weather pattern of a certain area…determines the BIOME an
area is divided into. We will discuss Biomes in the next section.
So, what causes different climates with their weather patterns? The major reason, again, is the sun, causing differences in insolation. Insolation is the
amount of solar radiation received on a surface (W/m2). Due to the tilt of the Earth, there are different
amounts of insolation for
different parts of the Earth. It is basis for the formation of the climates/biomes. There is a diagram of this below:
So, because of this, and the fact that the inside of the Earth gives off different amounts of heat to the surface, the Earth is heated unequally. When that happens, the air particles where there is more heat (energy) will rise, creating an area of low pressure below. Areas of less heat will have a higher pressure. The cooler air will rush in to fill the area left by the lower pressure. We know this movement as wind. Thus, air always flows from areas of high pressure (cool) to areas of low pressure (warm). Measuring the different pressures on Earth is a major way how meteorologists make their forecasts. We will get more into weather patterns and forecasting in 4.2.3.
There
are two types of wind systems we will discuss: Global Winds and Local Winds
Global Wind Systems
As stated before, air
generally moves from the poles to the equator, this is because air flows from
high pressure to low pressure. Globally, high
pressure forms when cold air sinks at the poles. Low
pressure forms when warm air rises at the equator. BUT, the air doesn't flow in a straight line. Why??? The answer lies in the Coriolis Effect.
The Coriolis Effect causes
air to move in a curved path. It
is caused by the Earth spinning on its axis, where the Earth spins fastest at the equator, and slowest near the poles. As
air moves from the equator to the pole, it will travel east faster than the
land beneath it causing the air to follow a curved path.
In
the Northern Hemisphere,
the Coriolis Effect causes wind to curve to the Right facing the north pole. In the Southern Hemisphere, the Coriolis Effect causes wind to curve to the Left facing the south pole.
The global winds blow across the entire planet and generally blow at the same speed and direction. Some
are high in the atmosphere and you cannot feel them on the ground. Each
hemisphere contains 3 wind belts that divide up the planetary winds: the Trade Winds, the Westerlies, and the Easterlies.
Trade Winds
The Trade Winds blow
toward the equator, an area of low pressure called Doldrums. They are located
between 0-30º north
and south. Called
trade winds because many European sailors used these winds for trade. In
northern hemisphere, trade winds come from the NE, so they are called Northeast trade winds.In
the southern hemisphere, trade winds come from the SE, so they are called Southeast trade winds. (Winds are named for the direction they travel from.)
Westerlies
The Westerlies are between
30º
and 60º
latitude. The high
pressure at 30º
causes air to descend and blow toward the poles. This zone of high pressure at 30º are
called Horse
Latitude. In
northern hemisphere, westerlies are southwest winds. In
the southern hemisphere, westerlies are northwest winds.
Easterlies
The Easterlies are located
above 60º
latitude (between 60-90º) at both poles. The high
pressure over the poles (caused by the sinking cold dense air) causes the air
to blow away from the poles toward 60º
latitude. At the north pole, they are northeast winds since the wind comes from the northeast. (Ho Ho Ho). At
the south pole, they are southeast winds since the wind comes from the
southeast
Here is a diagram of the Global Wind Patterns:
Local Wind Systems
Local winds blow over small areas. Unlike
global winds, local winds can change speed and direction frequently. These
are the winds we feel on the ground. They
are influenced by local conditions and local temperature variations.
In coastal areas, during
the day, the land heats up faster than the water, so a breeze will blow from
the sea to the land, called a sea breeze. At
night, the land will cool off faster than the water, so the cool land air will
flow toward the warmer ocean water air, creating a land breeze,
where the wind blows from the land to the sea.
In mountainous areas, during
the day, the valley heats up, so the warm less dense air flows up the mountain,
creating a valley breeze. At
night, the mountain will cool off faster than the valley, so the cool mountain
air descends because it is more dense, creating a mountain breeze.
Rain Shadows
When air moving inland from the ocean that contains a large
amount of water vapor meets the windward side of a mountain
range (the side facing the wind), it rises and begins to experience
adiabatic cooling. Because water vapor condenses as air cools, clouds form and
precipitation falls. The presence of the mountain range causes large amounts of
precipition to fall on its windward side. The cold, dry air then travels to the other side of the mountain
range (the leeward side), where it descends and experiences higher
pressures, which cause adiabatic heating. This air is now war and dry and process arid conditions on the
leeward side forming the region called a rain shadow.
Land Relief and Ocean Currents
Ocean currents and the land both play a major role in the variety of weather and climate on Earth. Watch the following video from NASA to learn about the impacts.
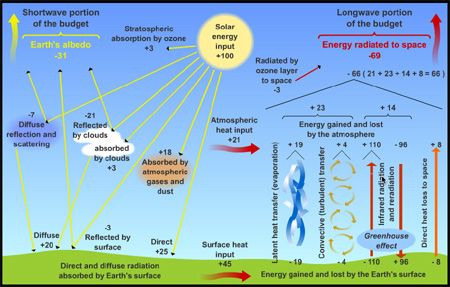
Energy flows from areas of higher temperature to areas of lower temperature. This is the driving force of weather.Heat is transferred through the atmosphere by radiation (waves), convection (through air particles), and conduction (direct contact). An 'Energy Budget' of the atmosphere is shown in the graphic below:
Let's discuss the features of the Energy Budget:
With the energy emanating from the sun (they give that energy a value of = +100), you can see where it goes:
3 is absorbed by ozone in the stratosphere
The rest happens in the troposphere:
31 is reflected back, mostly by clouds and some through diffusion reflection by gases and a little reflected by the surface - known as the Earth's albedo
3 is absorbed by clouds
18 is absorbed by atmospheric gases and dust
20 diffuses through gases to the surface
25 is directly given to the surface from the sun
Following, energy gets transferred/released in the following ways:
3 is radiated by ozone in the stratosphere
The rest happens in the troposphere
23 is released via evaporation in the form of latent heat and turbulence in the form of convective transfer
A total of 14 is lost due to infrared radiation due to the greenhouse effect
8 is directly released to space
That total, plus the albedoequals the +100 given by the sun.
As you can see above, almost all energy transfer happens in the troposphere. Thus, the troposphere is the major zone of weather alongside where almost all human activity take place (execpt spacecraft and jet planes).
ALL energy on the earth comes from the sun. The atmosphere is the region of space occupied by gases above the lithosphere, extending to space. The atmosphere protects us from intense energy from the sun and stores the oxygen we need to breathe.
The atmosphere has changed of the course of Earth's history. Early on, volcanoes gave off massive amounts of carbon dioxide and nitrogen. Then, over 2 billion years ago, small organisms began making oxygen. Once enough oxygen had formed the ozone layer, plants an life forms were protected enough to be able to start to appear.
The overall composition of the atmospheric gases is as follows:
Nitrogen - 78%
Oxygen - 21%
Water Vapor – 0 to 4%
(depends on region...clouds/rain/snow)
Carbon Dioxide - .037%
(needed to keep Earth from being ice-cold and is 'plant food')
Argon - .93%
Traces gases: neon, helium, methane, krypton,
xenon, hydrogen, and ozone
The atmosphere is classified into 4 distinct layers with their own characteristics:
Troposphere
Lowest layer – extends up to 10km from the crust
Contains 99% of the water
vapor and 75% of the atmospheric gases
Weather occurs here
Most of the layer’s heat is from the Earth itself
Temperature cools about 6.5 degrees Celsius per kilometer of
altitude. (Cooler as you go up)
Density of air particles decreases with altitude
Stratosphere
Directly above troposphere, extending from 10 km to about 50
km above Earth’s surface
Temperature gets WARMER as you increase in this layer
Density of air particles increases with altitude
Major home of high levels of a gas called
ozone
The ozone layer absorbs harmful rays from the
Sun
Layer of 3-atom molecules that protects the
Earth from the Sun’s harmful ultraviolet
radiation
Pollutants called chlorofluorocarbons (CFCs)
are destroying the ozone
Ozone layer has a large hole over Antarctica
and a smaller one over the North Pole
Currently closing due to CFC reduction efforts! #win
Mesosphere
Extends from the top of the stratosphere to about 85
km above Earth
Coldest layer with little ozone
Meteors or rock fragments burn up here
Temperatures decrease with altitude
Density of air particles decreases with altitude
Thermosphere (ionosphere)
Thickest atmospheric layer found between 85 km and 500 km
above Earth’s surface
Contains auroras (northern lights)
Very high
temperatures
Very little air particles
Warmed as it filters
out X-rays and gamma
rays from the Sun
Check out this image that shows descriptions for each layer. Notice the temp graph on the right...this is very important to remember:
The following video gives a pretty good explanation of weather balloons and how the hep us determine different properties, including the structure: